Phase contrast microscopy, first described in 1934 by Dutch physicist Frits Zernike, is a contrast-enhancing optical technique that can be utilized to produce high-contrast images of transparent specimens, such as living cells (usually in culture), microorganisms, thin tissue slices, lithographic patterns, fibers, latex dispersions, glass fragments, and subcellular particles (including nuclei and other organelles).
In effect, the phase contrast technique employs an optical mechanism to translate minute variations in phase into corresponding changes in amplitude, which can be visualized as differences in image contrast. One of the major advantages of phase contrast microscopy is that living cells can be examined in their natural state without previously being killed, fixed, and stained. As a result, the dynamics of ongoing biological processes can be observed and recorded in high contrast with sharp clarity of minute specimen detail.
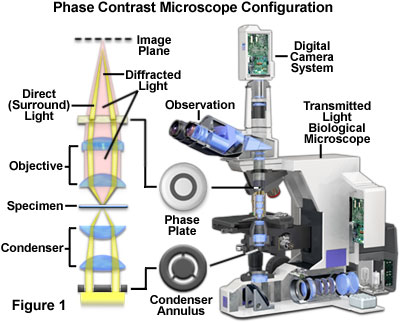
Presented in Figure 1 is a cut-away diagram of a modern upright phase contrast microscope, including a schematic illustration of the phase contrast optical train. Partially coherent illumination produced by the tungsten-halogen lamp is directed through a collector lens and focused on a specialized annulus (labeled condenser annulus) positioned in the substage condenser front focal plane. Wavefronts passing through the annulus illuminate the specimen and either pass through undeviated or are diffracted and retarded in phase by structures and phase gradients present in the specimen. Undeviated and diffracted light collected by the objective is segregated at the rear focal plane by a phase plate and focused at the intermediate image plane to form the final phase contrast image observed in the eyepieces.
Prior to the invention of phase contrast techniques, transmitted brightfield illumination was one of the most commonly utilized observation modes in optical microscopy, especially for fixed, stained specimens or other types of samples having high natural absorption of visible light. Collectively, specimens readily imaged with brightfield illumination are termed amplitude objects (or specimens) because the amplitude or intensity of the illuminating wavefronts is reduced when light passes through the specimen.
The addition of phase contrast optical accessories to a standard brightfield microscope can be employed as a technique to render a contrast-enhancing effect in transparent specimens that is reminiscent of optical staining (see Figure 2). Light waves that are diffracted and shifted in phase by the specimen (termed a phase object) can be transformed by phase contrast into amplitude differences that are observable in the eyepieces. Large, extended specimens are also easily visualized with phase contrast optics due to diffraction and scattering phenomena that occur at the edges of these objects. The performance of modern phase contrast microscopes is so refined that it enables specimens containing very small internal structures, or even just a few protein molecules, to be detected when the technology is coupled to electronic enhancement and post-acquisition image processing.
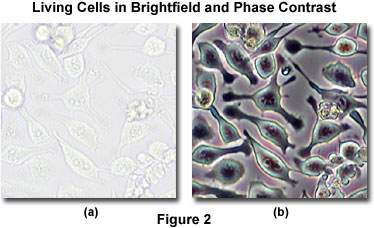
Presented in Figure 2 is a comparison of living cells in culture imaged in both brightfield and phase contrast illumination. The cells are human glial brain tissue grown in monolayer culture bathed with a nutrient medium containing amino acids, vitamins, mineral salts, and fetal calf serum. In brightfield illumination (Figure 2(a)), the cells appear semi-transparent with only highly refractive regions, such as the membrane, nucleus, and unattached cells (rounded or spherical), being visible. When observed using phase contrast optical accessories, the same field of view reveals significantly more structural detail (Figure 2(b)). Cellular attachments become discernable, as does much of the internal structure. In addition, the contrast range is dramatically improved.
Zernike¡¯s development of phase contrast optical theory is an excellent example of how research results from a highly specialized field (in this case, theoretical physics) can yield innovative new developments in seemingly unrelated disciplines, such as biology and medicine. During the Second World War, the Zeiss Optical Works in Jena, Germany, was the first manufacturer to incorporate practical phase contrast optics into their microscopes. The immediate impact on biological research was significant, and widespread application of the technique continues to the present day. Modern phase contrast objectives, designed and produced by Nikon and other optical manufacturers, are capable of operating in combination with auxiliary contrast-enhancing techniques, such as differential interference contrast, fluorescence, and polarized light. These objectives are available with internal phase plates that have varying levels of absorption and phase displacement of the surround (undiffracted) illumination to produce a wide spectrum of specimen contrast and background intensity choices for phase contrast microscopy.
Interaction of Light Waves with Phase Specimens
An incident wavefront present in an illuminating beam of light becomes divided into two components upon passing through a phase specimen. The primary component is an undeviated (or undiffracted; zeroth-order) planar wavefront, commonly referred to as the surround (S) wave, which passes through and around the specimen, but does not interact with it. In addition, a deviated or diffracted spherical wavefront (D-wave) is also produced, which becomes scattered over a wide arc (in many directions) that passes through the full aperture of the objective. After leaving the specimen plane, surround and diffracted light waves enter the objective front lens element and are subsequently focused at the intermediate image plane where they combine through interference to produce a resultant particle wave (often referred to as a P-wave). The mathematical relationship between the various light waves generated in phase contrast microscopy can be described simply as:
P = S + D
Detection of the specimen image depends on the relative intensity differences, and therefore on the amplitudes, of the particle and surround (P and S) waves. If the amplitudes of the particle and surround waves are significantly different in the intermediate image plane, then the specimen acquires a considerable amount of contrast and is easily visualized in the microscope eyepieces. Otherwise, the specimen remains transparent and appears as it would under ordinary brightfield conditions (in the absence of phase contrast or other contrast-enhancing techniques).
In terms of optical path variations between the specimen and its surrounding medium, the portion of the incident light wavefront that traverses the specimen (D-wave), but does not pass through the surrounding medium (S-wave), is slightly retarded. For arguments in phase contrast microscopy, the role of the specimen in altering the optical path length (in effect, the relative phase shift) of waves passing through is of paramount importance. In classical optics, the optical path length (OPL) through an object or space is the product of the refractive index (n) and the thickness (t) of the object or intervening medium as described by the relationship:
Optical Path Length (OPL) = n ¡Á t
When light passes from one medium into another, the velocity is altered proportionally to the refractive index differences between the two media. Thus, when a coherent light wave emitted by the focused microscope filament passes through a phase specimen having a specific thickness (t) and refractive index (n), the wave is either increased or decreased in velocity. If the refractive index of the specimen is greater than that of the surrounding medium, the wave is reduced in velocity while passing through the specimen and is subsequently retarded in relative phase when it emerges from the specimen. In contrast, when the refractive index of the surrounding medium exceeds that of the specimen, the wave is advanced in phase upon exiting the specimen. The difference in location of an emergent wavefront between the specimen and surrounding medium is termed the phase shift (¦Ä) and is defined in radians as:
¦Ä = 2¦Ð¦¤/¦Ë
In the equation above, the term D is referred to as the optical path difference, which is similar to the optical path length:
Optical Path Difference (OPD) = ¦¤ = (n2 - n1) ¡Á t
where n(2) is the refractive index of the specimen and n(1) is the refractive index of the surrounding medium. The optical path difference results from the product of two terms: the thickness of the specimen, and its difference in refractive index with the surrounding medium. In many cases, the optical path difference can be quite large even though the thickness of the specimen is small. On the other hand, when the refractive index of the specimen equals that of the surrounding medium, the optical path difference is zero regardless of whether the specimen thickness is large or small.
Interactive Java Tutorial
Optical Path Length
Explore the effects of changes to refractive index and thickness on optical path length, and discover how two specimens can have different combinations of these variables but still display the same path length.
For individual cells in tissue culture, the optical path difference is relatively small. A typical cell in monolayer culture has a thickness around 5 micrometers and a refractive index of approximately 1.36. The cell is surrounded by a nutrient medium having a refractive index of 1.335, which yields an optical path difference of 0.125 micrometer, or about a quarter wavelength (of green light). Subcellular structures generate much smaller retardations. These small optical path differences produce a linear reduction in intensity with increasing phase shift (the image grows progressively darker) up to a point (depending upon phase plate configuration), after which, the specimen image becomes brighter through reversal of contrast. In phase contrast microscopy, the intensity of an image does not bear a simple linear relationship to the optical path difference produced by the specimen for the entire thickness and refractive index range. Instead, intensity is dependent on a variety of factors including absorption at the phase plate, the degree of phase advancement or retardation at the phase plate, and the relative sign of this phase shift.
Wave Interactions in Phase Contrast Microscopy
Phase relationships between the surround, diffracted, and particle (S, D, and P) waves in the region of the specimen at the image plane for brightfield microscopy (in the absence of phase contrast optical accessories) are presented in Figure 3. The surround and particle waves, whose relative amplitudes determine the amount of specimen contrast, are illustrated as red and green lines (respectively). The wave produced by diffraction from the specimen, which is never directly observed, is depicted as a blue wave of lower amplitude. The surround and diffracted waves recombine through interference to generate the resultant particle wave in the image plane of the microscope. The amplitude of each wave illustrated in Figure 3 represents the sum of the electric vectors of the individual component waves.
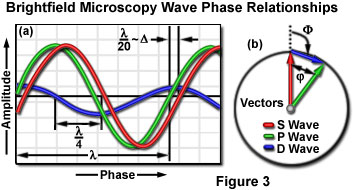
Relative to the surround wave, the diffracted wave has lower amplitude (because there are fewer diffracted than surround photons at the image point) and is retarded in phase by approximately 90 degrees (a quarter wavelength) through interaction with the specimen. The slight phase shift of 1/20th wavelength exhibited by the resultant particle wave (which arises from interference between the diffracted and surround waves) is typically observed for minute details in a cell, and is related to the optical path length difference. Because the amplitudes of the surround and particle waves are nearly the same, the transparent specimen completely lacks contrast and is almost invisible when superimposed against the bright background.
The relationship between individual wavefronts in brightfield and phase contrast microscopy can be described vectorially using a system of polar coordinates. In this system, the vector length represents the amplitude of a particular wave, while the angle of rotation of the vector relative to a fixed reference (the angular phase shift) signifies the degree of phase displacement (see Figure 3(b)). Vector representation of wave interactions in phase contrast microscopy was introduced by Frits Zernike, and later developed in detail by Robert Barer. Although this descriptive aid is seldom utilized today, many texts and research reports published over the past few years rely on discussions of wave relationships illustrated by vector diagrams.
In phase contrast vector diagrams, phase retardations are illustrated as clockwise rotations (with reference to an arbitrary azimuth), whereas phase advancements are depicted as counterclockwise rotations. In Figure 3(b), which is technically a phasor diagram, the vector sum of the surround (S) and diffracted (D) wavefronts yields the resultant particle (P) wavefront. This mechanism of presenting wave relationships is convenient because it aids the visualization of phase shifts in the diffracted wave and how they affect the phase of the resultant particle wave (and vice versa). The phase shift of the diffracted wave relative to the surround wave on the graph in Figure 3(b) is presented as ¦µ, where:
¦µ = ¡À 90¡ã + ¦Õ/2
In the equation, ¦Õ is the relative phase shift (a function of the optical path difference) between the surround (S) and particle (P) wave vectors. For specimens displaying a negligible optical path difference (in effect, no phase shift), the latter term of the equation equals zero and ¦µ becomes ¡À 90 degrees. As presented in Figure 3(b), a diffracted (D) wave having a very low amplitude and small (or nonexistent) phase shift results in a particle wave with an amplitude that is nearly equal to that of the surround wave. When the surround and particle waves have similar amplitudes (or intensities), there is no generation of contrast, and the specimen remains invisible on a bright background.
The Phase Contrast Microscope
The most important concept underlying the design of a phase contrast microscope is the segregation of surround and diffracted wavefronts emerging from the specimen, which are projected onto different locations in the objective rear focal plane (the diffraction plane at the objective rear aperture). In addition, the amplitude of the surround (undeviated) light must be reduced and the phase advanced or retarded (by a quarter wavelength) in order to maximize differences in intensity between the specimen and background in the image plane. The mechanism for generating relative phase retardation is a two-step process, with the diffracted waves being retarded in phase by a quarter wavelength at the specimen, while the surround waves are advanced (or retarded) in phase by a phase plate positioned in or very near the objective rear focal plane. Only two specialized accessories are required to convert a brightfield microscope for phase contrast observation. A specially designed annular diaphragm, which is matched in diameter and optically conjugate to an internal phase plate residing in the objective rear focal plane, is placed in the condenser front focal plane.
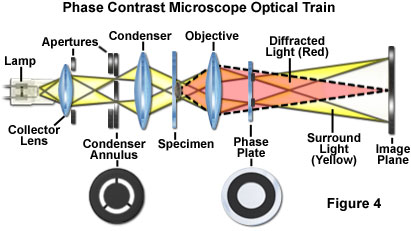
The condenser annulus (illustrated in Figure 1 and Figure 4) is typically constructed as an opaque flat-black (light absorbing) plate with a transparent annular ring, which is positioned in the front focal plane (aperture) of the condenser so the specimen can be illuminated by defocused, parallel light wavefronts emanating from the ring. The microscope condenser images the annular diaphragm at infinity, while the objective produces an image at the rear focal plane (where a conjugate phase plate is positioned, as discussed below). It should be noted that many texts describe the illumination emergent from the condenser of a phase contrast microscope as a hollow cone of light with a dark center. This concept is useful for describing the configuration, but is not strictly accurate. The condenser annulus either replaces or resides close to the adjustable iris diaphragm in the front aperture of the condenser. When conducting phase contrast experiments utilizing a condenser with both a phase annulus and an aperture diaphragm, check to ensure that the iris diaphragm is opened wider than the periphery of the phase annulus. Unlike differential interference contrast and Hoffman modulation contrast, the circular geometry of phase contrast illumination and detection enables specimen observation without orientation-dependent artifacts. Phase contrast is also insensitive to polarization and birefringence effects, which is a major advantage when examining living cells growing in plastic tissue culture vessels.
Under conditions of Köhler illumination, surround light waves that do not interact with the specimen are focused as a bright ring in the rear focal plane of the objective (the diffraction plane). Under these conditions, the objective rear focal plane is conjugate to the condenser front aperture plane, so non-diffracted (zeroth order) light waves form a bright image of the condenser annulus at the rear aperture of the objective (superimposed over the image of the phase plate). The spherical wavefront that is diffracted by the specimen (the D waves) passes through the diffraction plane at various locations across the entire objective rear aperture. The distribution (amount and location) of diffracted light depends on the number, size, and refractive index differential of light-scattering objects in the specimen. For most specimens, only a small portion of the incident light waves are diffracted, and a majority of the light passes through undeviated to eventually illuminate the entire image plane.
In contrast, the surround planar wavefront occupies a smaller proportion of the objective rear aperture, which corresponds to the conjugate of the condenser annulus. Thus, the two wavefronts do not overlap to a significant extent, and occupy distinct portions of the objective rear focal plane. Because the direct, zeroth order light and diffracted light are spatially separated in the diffraction plane, the phase of either wave component (surround, S or diffracted, D) can be selectively manipulated without interfering with the other.
Interactive Java Tutorial
Phase Microscope Optical Pathways
Examine the light pathways through a phase contrast microscope and learn how these systems dissect the incident electromagnetic wave into a surround (S), diffracted (D), and resultant particle (P) component.
A phase plate is mounted in or near the objective rear focal plane (see Figures 4 and 5) in order to selectively alter the phase and amplitude of the surround (or undeviated) light passing through the specimen. In some phase contrast objectives, the thin phase plate contains a ring etched into the glass that has reduced thickness in order to differentially advance the phase of the surround (S) wave by a quarter-wavelength. Often, the ring is also coated with a partially absorbing metallic film to reduce the surround light amplitude by 60-90 percent. Because the rear focal plane usually resides near an internal lens element, some phase contrast objectives are produced by actually etching into the surface of a lens. Regardless of how the objective is manufactured, the most important point to remember is that every phase contrast objective is modified to include the phase plate, a feature that is absent from all other microscope objectives.
Because the resultant particle wave is produced exclusively by interference of the surround and diffracted wavefronts, interference between the wavefronts arriving at the image plane generates a particle (P) wave having an amplitude that is now considerably less than that of the surround when the neutral density coating is applied. The net effect is to transform the relative phase difference introduced by the specimen into a difference in amplitude (intensity) of the light emerging from the image plane. Because the human eye interprets differences in intensity as contrast, the specimen is now visible in the microscope eyepieces, and can also be captured on film with a traditional camera system, or digitally, utilizing a CCD or CMOS device. All positive phase contrast systems selectively advance the phase of the linear surround (S) wavefront relative to that of the spherical diffracted (D) wavefront. Alternatively, negative phase contrast retards the surround wavefront with respect to the light waves diffracted by the specimen.
In general, specimens having a higher refractive index than the surrounding medium appear dark on a neutral gray background, while those specimens that have a lower refractive index than the bathing medium appear brighter than the gray background. This is not always the case, however, because specialized phase contrast objectives having higher neutral densities coupled to lower retardation values (one-eight of a wavelength or less) can produce contrast inversion in thicker specimens. The net result is that regions with very high optical path differences begin to appear bright.
In order to modify the phase and amplitude of the spatially separated surround and diffracted wavefronts in phase contrast optical systems, a number of phase plate configurations have been introduced. Because the phase plate is positioned in or very near the objective rear focal plane (the diffraction plane) all light passing through the microscope must travel through this component. The portion of the phase plate upon which the condenser annulus is focused is termed the conjugate area, while the remaining regions are collectively referred to as the complementary area. The conjugate area contains the material responsible for altering the phase of the surround (undiffracted) light by either plus or minus 90-degrees with respect to that of the diffracted wavefronts. In general, the phase plate conjugate area is wider (by about 25 percent) than the region defined by the image of the condenser annulus in order to minimize the amount of surround light that spreads into the complementary area.
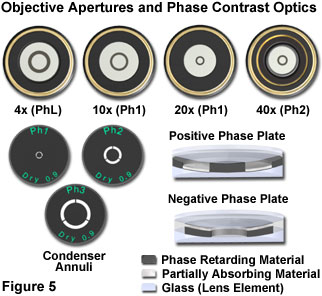
A typical series of phase contrast objectives having increasing magnification, and their corresponding condenser annuli, are presented in Figure 5. As a general rule, when objective numerical aperture and magnification is increased, the phase plate width and diameter both decrease. In contrast, the condenser annulus size increases with objective magnification. Also illustrated in Figure 5 are cut-away diagrams showing the basic concepts behind positive and negative phase plate construction. The positive phase plate produces dark contrast and contains a partially absorbing film designed to reduce the amplitude of the surround wavefront. In addition, this plate contains phase retarding material designed to shift (retard) the phase of the diffracted light by 90 degrees. The negative phase plate also contains both phase retarding and partially absorbing materials. However, in this case, both materials are sandwiched within the phase plate so that the undiffracted surround wavefront is the only species affected (attenuated and retarded in phase by 90 degrees).
Most of the phase plates available from modern microscope manufacturers are produced by vacuum deposition of thin dielectric and metallic films onto a glass plate or directly onto one of the lens surfaces within the microscope objective. The role of the dielectric thin film is to shift the phase of light, while the metallic film attenuates undiffracted light intensity. Some manufacturers utilize multiple antireflection coatings in combination with the thin films to reduce the amount of glare and stray light reflected back into the optical system. If the phase plate is not formed on the surface of a lens, it is usually cemented between successive lenses that reside near the objective rear focal plane. The thickness and refractive indices of the dielectric, metallic, and anti-reflective films, as well as those of the optical cement, are carefully selected to produce the necessary phase shift between the complementary and conjugate areas of the phase plate. In optical terminology, phase plates that alter the phase of surround light relative to diffracted light by 90 degrees (either positive or negative) are termed quarter wavelength plates because of their effect on the optical path difference.
Contrast is modulated by varying the properties of the phase plate, including the absorption of the metallic film (or anti-reflective coatings), the refractive index of the phase retarding material, and the thickness of the phase plate. Several microscope manufacturers offer a variety of phase contrast objectives having progressive degrees of contrast. For example, the Nikon lineup includes five types of phase contrast objectives. The DL (Dark Low) series of objectives produces a dark image outline on a light gray background. These objectives are designed to furnish positive contrast in specimens having a significant difference in refractive index from the surrounding medium, such as tissue culture cells. A slightly lower contrast version objective, the DLL (Dark Low Low), yields better images in brightfield illumination than do the DL objectives, and is utilized as a universal objective for combined observations in fluorescence, brightfield, darkfield, and differential interference contrast.
Nikon also produces an apodized phase contrast objective that contains a secondary neutral density ring, designed to reduce halo artifacts, on either side of the central phase ring. Specimens having very small phase differences are ideal candidates for imaging with Nikon¡¯s DM (Dark Medium) positive phase contrast objectives, which produce a dark image outline on a medium gray background. For negative phase contrast, Nikon offers the BM (Bright Medium) objective, which is especially suited for visual examination of bacterial flagella, protozoa, fibrin fibers, minute globules, and blood cells. Bright medium phase contrast objectives produce bright images on a medium gray background.
In most cases, merely advancing the relative phase of the surround wavefront alone is insufficient to result in the generation of high-contrast images in the microscope. This occurs because the amplitude of the surround waves is significantly larger than that of the diffracted waves and suppresses the resulting images created by interference from only a small portion of the total number of waves. In order to reduce the amplitude of the surround wavefront to a value closer to that of the diffracted wave (and enforce interference at the image plane), the phase plate in the objective is increased in opacity by application of a semi-transparent metallic (neutral density) coating. Surround light waves, which pass almost exclusively through the phase plate by design in the phase contrast microscope, are dramatically decreased in amplitude by the opaque phase plate to a value that ranges between 10 and 30 percent of the original intensity.
The phase plate configurations, wave relationships, and vector diagrams associated with the generation of positive and negative phase contrast images are presented in Figure 6. In addition, examples of specimens imaged by these techniques are also illustrated. As previously discussed, the spherical wavefront of diffracted light emerging from the specimen plane is retarded by a quarter-wavelength relative to the phase of the planar surround (or undiffracted) wavefront. In the positive phase contrast optical configuration (upper row of images in Figure 6), the surround (S) wavefront is advanced in phase by a quarter-wavelength when traversing the phase plate to produce a net phase shift of 180 degrees (one half wavelength). The advanced surround wavefront is now able to participate in destructive interference with the diffracted (D) waves at the intermediate image plane.
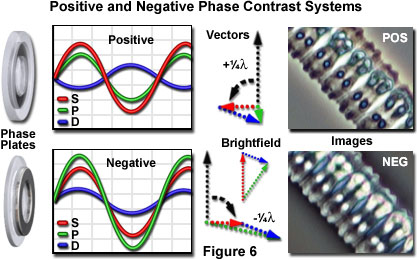
An overview of positive phase contrast is presented in the upper portion of Figure 6. Positive phase contrast plates (left-hand side of Figure 6) advance the surround wave by a quarter-wavelength due to the etched ring in the glass plate that reduces the physical path taken by the waves through the high refractive index plate. Because the diffracted specimen rays (D waves) are retarded by a quarter-wavelength when interacting with the specimen, the optical path difference between the surround and diffracted waves upon emergence from the phase plate is one-half wavelength. The net result is a 180-degree optical path difference between the surround and diffracted waves, which results in destructive interference for a high refractive index specimen at the image plane. The amplitude profiles of the destructively interfering waves for positive phase contrast are depicted in the upper graph of Figure 6. The amplitude of the resultant particle (P) wave is lower than the surround (S) wave, causing the object to appear relatively darker than the background, as illustrated by the image of Zygnema green algae at the far right (labeled POS). A vector diagram illustrating advancement of the surround wave by a quarter-wavelength, which is shown as a 90-degree counterclockwise rotation in positive phase contrast, appears between the graph and the image in Figure 6.
It is also possible to produce microscope optical systems yielding negative phase contrast, as illustrated in the lower portion of Figure 6. In this case, the surround (S) wave is retarded (rather than being advanced) by a quarter-wavelength relative to the diffracted (D) wave. The result is that specimens having high refractive indices appear bright against a darker gray background (see the image labeled NEG in the lower portion of Figure 6). In negative phase contrast, the objective phase plate contains an elevated ring that retards the phase (rather than advancing the phase as in positive phase contrast) of the zeroth-order surround wave by a quarter-wavelength relative to the phase of the diffracted wave. Because the diffracted wave has already been retarded by a quarter-wavelength when passing through the specimen, the optical path difference between the surround and diffracted waves is eliminated, and constructive interference occurs for a high refractive index specimen at the image plane. Note that the resulting particle (P) wave is higher in amplitude than the surround (S) wave in negative phase contrast (see the lower graph in Figure 6). Also illustrated is the vector diagram for negative phase contrast, where the surround wave vector undergoes a 90-degree clockwise rotation.
Interactive Java Tutorial
Positive and Negative Phase Contrast
This interactive tutorial explores relationships between the surround (S), diffracted (D), and resulting particle (P) waves in brightfield as well as positive and negative phase contrast microscopy.
It is important to note that the diffraction pattern formed at the objective rear focal plane is the Fourier transform of all spatial frequencies deviated and scattered by the specimen in phase contrast and all other forms of optical microscopy. Consequently, the image produced at the intermediate image plane and the final image observed through the eyepieces (or recorded by a detector) represent inverse Fourier transforms of the diffraction patterns formed at the objective rear focal plane and the eyepoint (floating above the eyepiece front lens), respectively. Phase contrast microscopy takes advantage of these optical conjugate properties to enhance image contrast by modifying the microscope aperture function to introduce spatial filtration of specific image information. Introduction of a phase plate (filter) in the objective rear diffraction plane enables transformation of specimen phase variations into intensity variations that can be observed in the final image.
Interpretation of Phase Contrast Images
Images produced by phase contrast microscopy are relatively simple to interpret when the specimen is thin and distributed evenly on the substrate (as is the case with living cells grown in monolayer tissue culture). When thin specimens are examined using positive phase contrast optics, which is the traditional form produced by most manufacturers, they appear darker than the surrounding medium when the refractive index of the specimen exceeds that of the medium. Phase contrast optics differentially enhance the contrast near the edges surrounding extended specimens, such as the boundary between a cellular membrane and the bathing nutrient medium, and produce overall high-contrast images that can be roughly interpreted as density maps. Because the amplitude and intensity of a specimen image in phase contrast is related to refractive index and optical path length, image density can be utilized as a gauge for approximating relationships between various structures. In effect, a series of internal cellular organelles having increasing density, such as vacuoles, cytoplasm, the interphase nucleus, and the nucleolus (or mitotic chromosomes), are typically visualized as progressively darker objects relative to a fixed reference, such as the background. It should also be noted that numerous optical artifacts are present in all phase contrast images, and large extended specimens often present significant fluctuations in contrast and image intensity. Symmetry can also be an important factor in determining how both large and small specimens appear in the phase contrast microscope.
Sensible interpretation of phase contrast images requires careful scrutiny and examination to ensure that artifacts are not incorrectly assigned to important structural features. For example, some internal cellular organelles and components often have a lower refractive index than that of the surrounding cytoplasm, while others have a higher refractive index. Because of the varying refractive indices exhibited by these numerous intracellular structures, the interior of living cells, when viewed in a positive phase contrast microscope, can reveal an array of intensities ranging from very bright to extremely dark. For example, pinocytotic vesicles, lipid droplets, and air vacuoles present in plants and single cell protozoans have a lower refractive index than the cytoplasm, and thus appear brighter than other components. In contrast, as discussed above, organelles that have high refractive indices (nuclei, ribosomes, mitochondria, and the nucleolus) appear dark in the microscope. If the phase retardation introduced by the specimen is large enough (a phase shift of the diffracted wave by approximately a half-wavelength), interference between the diffracted waves and the surround waves becomes constructive, rendering these specimens brighter than the surrounding background.
In order to avoid confusion regarding bright and dark contrast in phase contrast images, the optical path differences occurring within the specimen preparation should be carefully considered. As discussed above, the optical path difference is derived from the product of the refractive index and the specimen (object) thickness, and is related to the relative phase shift between the specimen and background (diffracted and surround) waves. It is impossible to distinguish between high and low refractive index components in a phase contrast image without information pertaining to the relative thickness of the components. For example, a small specimen having a high refractive index can display an identical optical path difference to a larger specimen having a lower refractive index. The two specimens will have approximately the same intensity when viewed through a phase contrast optical system. In many biological experiments, conditions that produce a shrinking or swelling of cells or organelles can result in significant contrast variations. The external medium can also be replaced with another having either a higher or lower refractive index to generate changes in specimen image contrast. In fact, the effect on image contrast of refractive index variations in the surrounding medium forms the basis of the technique known as immersion refractometry.
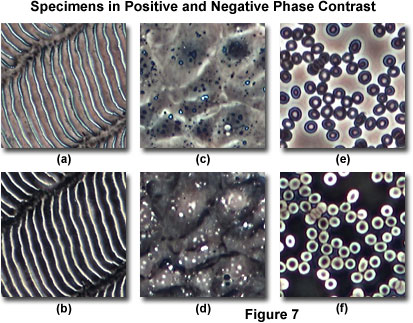
Presented in Figure 7 are several semi-transparent specimens imaged with both positive and negative phase contrast optical systems. Figures 7(a) and 7(b) illustrate a ctenoid fish scale in positive phase contrast (Figure 7(a)) and negative phase contrast (Figure 7(b)) at relatively high magnification (200x). These scales are commonly found in the majority of bony fishes (referred to as the Teleostei). The anterior (or front) part of each scale is usually tucked behind the rear portion of the preceding scale. As the fish grows, so do the scales, resulting in a pattern of concentric growth "rings" that increase in number with the scale size and appear similar to those found in the cross section of tree trunks. In some cases, ctenoid scale growth patterns are utilized to estimate the age of a fish. The growth rings appear dark surrounded by lighter gray halo regions in positive phase contrast (Figure 7(a)), but are rendered much lighter and surrounded by dark troughs with negative phase contrast (Figure 7(b)).
A culture of living Chinese hamster ovary cells appears transparent in brightfield illumination mode when bathed in growth medium, and the cells have a refractive index that is very close to the nutrient saline buffer. In positive phase contrast (Figure 7(c)), internal cellular details, including the nucleus and organelles, can be readily visualized. However, when examined under negative phase contrast illumination, the cellular outlines become difficult to distinguish, and internal details are largely obscured with the exception of high-refractive index organelles that become very bright (Figure 7(d)). Finally, human erythrocytes appear as dark gray oblate ellipsoids featuring a doughnut contour and bright centers in positive phase contrast (Figure 7(e)), but the same cells are bright with dark centers (Figure 7(f)) and stand out sharply from the background in negative phase contrast.
Two very common effects in phase contrast images are the characteristic halo and shade-off contrast patterns in which the observed intensity does not directly correspond to the optical path difference (refractive index and thickness values) between the specimen and the surrounding medium. Although these patterns occur as a natural result of the phase contrast optical system, they are often referred to as phase artifacts or image distortions. In all forms of positive phase contrast, bright phase halos usually surround the boundaries between large specimen features and the medium. Identical halos appear darker than the specimen with negative phase contrast optical systems. These effects are further accentuated by optical path difference fluctuations, which can turn bright halos dark in positive phase contrast, and dark halos bright in negative phase contrast.
Halos occur in phase contrast microscopy because the circular phase-retarding (and neutral density) ring located in the objective phase plate also transmits a small degree of diffracted light from the specimen (it is not restricted to passing surround waves alone). The problem is compounded by the fact that the width of the zeroth-order surround wavefront projected onto the phase plate by the condenser annulus is smaller than the actual width of the phase plate ring. The difference in width between the phase plate ring and surround wavefront is usually around 25 to 40 percent, but is necessary due to restrictions and requirements of the optical design. Because of the spatial location of the circular phase-altering ring in the objective diffraction plane, only those wavefronts corresponding to low spatial frequencies diffracted by the specimen pass through the annulus of the phase plate. Thus, the diffracted specimen waves passing through the phase plate remain 90-degrees (a quarter-wavelength) out of phase relative to the zeroth-order (undeviated or surround) light. The resulting phase contrast halo artifact is due to attenuation of the low spatial frequency information diffracted by the specimen through a very shallow angle with respect to the zeroth-order surround wavefronts. In effect, the absence of destructive interference between low spatial frequency wavefronts diffracted by the specimen and undeviated light waves produces a localized contrast reversal (manifested by the halo) surrounding the specimen. In order to create a sharp edge in the image, all of the spatial frequencies diffracted by the specimen must be represented in the final image.
Interactive Java Tutorial
Shade-Off and Halo Artifacts

Explore shade-off and halo artifacts, where the observed intensity does not directly correspond to the optical path difference (refractive index and thickness values) between the specimen and the surrounding medium.
Phase contrast halos are especially prominent and noticeable around large, low spatial frequency objects such as nuclei, diatoms, and entire cells. Another contributing factor to the halo artifact is the redistribution of light energy at the image plane, from regions where it is destructive to regions where it is constructive. Large, high contrast halos can produce confusing images for specimens generating large optical path differences, such as erythrocytes, molds, protozoa, yeast cells, and bacteria. On the other hand, halo effects can often emphasize contrast differences between the specimen and its surrounding background and can increase the visibility of thin edges and border details in many specimens. This effect is particularly helpful in negative phase contrast, which produces a dark halo surrounding low frequency image detail. In many cases it is possible to reduce the degree of phase shift and diffraction, resulting in reduced halo size around the specimen. The easiest remedy for removing or attenuating the intensity of halos is to modify the refractive index of the observation medium with higher refractive index components, such as glycerol, mannitol, dextran, or serum albumin. In some cases, changing the refractive index of the medium can even produce a reversal in image contrast, turning dark specimen features bright without significantly disturbing the background intensity.
The halo effect can also be significantly reduced by utilizing specially designed phase objectives that contain a small ring of neutral density material surrounding the central phase ring material near the objective rear aperture. These objectives are termed apodized phase contrast objectives, and enable structures of phase objects having large phase differences to be viewed and photographed with outstanding clarity and definition of detail. In most cases, subcellular features (such as nucleoli) can be clearly distinguished as having dark contrast with apodized objectives, but these same features have bright halos or are imaged as bright spots using conventional phase contrast optics. With the apodized optics, contrast is reversed due to the large amplitude of diffracted light relative to that of the direct light passing through the specimen.
In practice, halo reduction and an increase in specimen contrast with apodized optical systems can be achieved by the utilization of selective amplitude filters located adjacent to the phase film in the phase plates built into the objective at the rear focal plane. These amplitude filters consist of neutral density thin films applied to the phase plate surrounding the phase film. The transmittance of the phase shift ring in the classical phase plate is approximately 25 percent, while the pair of adjacent rings surrounding the phase shift ring in the apodized plate have a neutral density with 50 percent transmittance. The width of the phase film in both plates is the same. These values are consistent with the transmittance values of phase shifting thin films applied to standard plates in phase contrast microscopes.
Shade-off is another very common optical artifact in phase contrast microscopy, and is often most easily observed in large, extended phase specimens. It would normally be expected that the image of a large phase specimen having a constant optical path length across the diameter would appear uniformly dark or light in the microscope. Unfortunately, the intensity of images produced by a phase contrast microscope does not always bear a simple linear relationship to the optical path difference produced by the specimen. Other factors, such as absorption at the phase plate and the amount of phase retardation or advancement, as well as the relative overlap size of the phase plate and condenser annulus also play a critical role. The intensity profile of a large, uniformly thick positive phase contrast specimen often gradually increases from the edges to the center, where the light intensity in the central region can approach that of the surrounding medium (the reverse is true for negative phase specimens). This effect is termed shade-off, and is frequently observed when examining extended planar specimens, such as material slabs (glass or mica), replicas, flattened tissue culture cells, and large organelles.
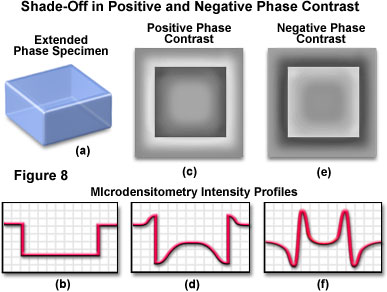
The effects of halo and shade-off artifacts in both positive and negative phase contrast are presented in Figure 8 for a hypothetical extended phase specimen having rectangular geometry and a higher refractive index than the surrounding medium (Figure 8(a)). The intensity profile recorded across a central region of the specimen is illustrated in Figure 8(b). In positive phase contrast (Figure 8(c)), the specimen image exhibits a distinctively bright halo and demonstrates a dramatic shade-off effect, which is manifested by progressively increasing intensity when traversing from the edges to the central region of the specimen (see the intensity profile in Figure 8(d)). The halo and shade-off effects have reversed intensities in negative phase contrast (Figure 8(e) and 8(f)). A dark halo surrounds the specimen image when viewed with negative phase contrast optics (Figure 8(e)), and the shade-off transition ranges from bright at the edges to darker gray levels in the center. In addition, the intensity profile (Figure 8(f)) is reversed from that observed with positive phase contrast.
The shade-off phenomenon is also commonly termed the zone-of-action effect, because central zones having uniform thickness in the specimen diffract light differently than the highly refractive zones at edges and boundaries. In the central regions of a specimen, both the relative angles and the amount of diffracted light are dramatically reduced when compared to the edges. Because diffracted wavefronts originating from the central specimen areas have only a marginal spatial deviation from the zeroth-order non-deviated surround wavefronts (but are still retarded in phase by a quarter-wavelength),, they are captured by the phase plate in the objective rear focal plane, along with the surround light. As a result, the intensity of the central specimen region remains essentially identical to that of the background. The appearance of shade-off effects in relatively flat planar specimen areas, along with the excessively high contrast produced by edges and boundaries, provides strong evidence that the phase contrast mechanism is primarily controlled by the combined phenomena of diffraction and scattering.
Halo and shade-off artifacts depend on both the geometrical and optical properties of the phase plate and the specimen being examined. In particular, the width and transmittance of the phase plate material play a critical role in controlling these effects (the phase plate width is typically about one-tenth the total aperture area of the objective). Wider phase plates having reduced transmittance tend to produce higher intensity halos and shade-off, whereas the ring diameter has a smaller influence on these effects. For a particular phase objective (either positive or negative), the optical path difference and specimen size, shape, and structure have significant influence on the severity of halo and shade-off effects. In addition, these effects are heavily influenced by the objective magnification, with lower magnifications producing better images.
Conclusions
Phase contrast is an excellent method for enhancing the contrast of thin, transparent specimens without loss of resolution, and has proven to be a valuable tool in the study of dynamic events in living cells. Prior to the introduction of phase contrast optical systems, cells and other semi-transparent specimens were rendered visible in brightfield microscopy by artificial staining techniques. Although these specimens can be observed and recorded with darkfield and oblique illumination, or by defocusing a brightfield microscope, this methodology has proven unreliable in providing critical information about cellular structure and function.
The technique of phase contrast is widely applied in biological and medical research, especially throughout the fields of cytology and histology. As such, the methodology is utilized to examine living cells, tissues, and microorganisms that are transparent under brightfield illumination. Phase contrast enables internal cellular components, such as the membrane, nuclei, mitochondria, spindles, mitotic apparatus, chromosomes, Golgi apparatus, and cytoplasmic granules from both plant and animal cells and tissues to be readily visualized. In addition, phase contrast microscopy is widely employed in diagnosis of tumor cells and the growth, dynamics, and behavior of a wide variety of living cells in culture. Specialized long-working distance phase contrast optical systems have been developed for inverted microscopes employed for tissue culture investigations. Other areas in the biological arena that benefit from phase contrast observation are hematology, virology, bacteriology, parasitology, paleontology, and marine biology.
Industrial and chemical applications for phase contrast include mineralogy, crystallography, and polymer morphology investigations. Colorless microcrystals, powders, particulate solids, and crystalline polymers, having a refractive index that differs only slightly from that of the surround immersion liquid, are often easily observed using phase contrast microscopy. In fact, quantitative refractometry is often utilized to obtain refractive index values and for identification purposes. Other commercial products scrutinized by phase contrast optical techniques include clays, fats, oils, soaps, paints, pigments, foods, drugs, textiles, and other fibers.
Incident light phase contrast microscopy, although largely supplanted by differential interference contrast techniques, is useful for examination of surfaces, including integrated circuits, crystal dislocations, defects, and lithography. A good example is the stacking faults in silicon epitaxial wafers, which are of tremendous significance to the semiconductor industry. In reflected light phase contrast systems, an image of the illuminating annulus is projected into the rear focal plane of the objective, where the phase plate is normally located. In addition, the phase plate is not positioned within the objective, but an image of the rear focal plane is formed by an auxiliary lens system that avoids reflections and scattering generated by the phase plate. It should be noted that in reflected light phase contrast microscopy, phase differences arise from relief on the specimen surfaces, rather than phase gradients within the specimen.
Reduction in halo and shading-off artifacts remains a primary concern in phase contrast microscopy. Apodized phase plates are useful for reducing the severity of halo, and specialized variable phase contrast systems can be fine-tuned to control these effects in order to optimize image quality and the fidelity of information obtained by the technique. There is also considerable interest in development of advanced phase contrast systems that provide accurate measurements of phase specimens having large optical path differences, as well as combined observations with other contrast-enhancing techniques. In particular, phase contrast is often utilized with fluorescence imaging to determine the locations of fluorophores, and shows promise for enhancing contrast in scanning optical microscopy. |